It would be great if an easy-to-use interactive dashboard for businesses tracked activities such as real-time sales pipeline flow, new product activation or purchases, campaign effectiveness, budget vs actual spends, etc. The visualization below is from the USGS and it tracks all earthquakes that happen around the world. It can be filtered to show either all magnitudes or 2.5 M and above, and within the last 7 or 30 days. And, this map display has evolved over the past several years to what it is today. There is a beta mobile version of it, though it doesn't seem to spew out useful data to a casual observer.
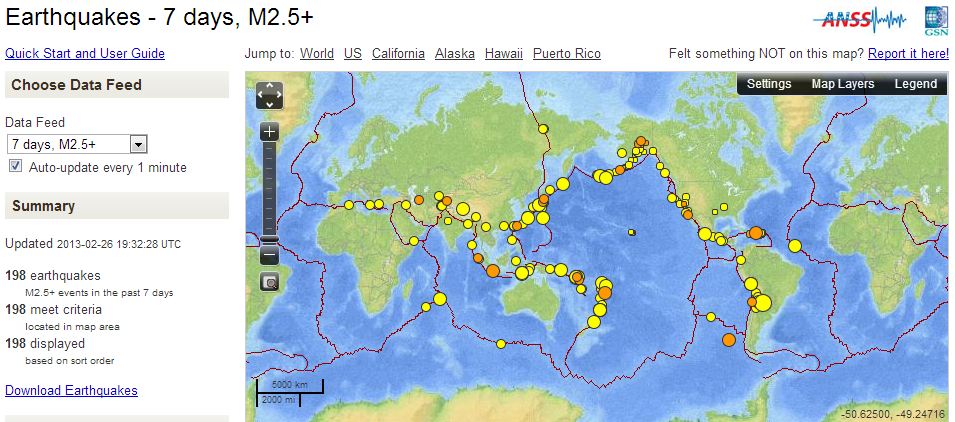 |
| USGS: real-time display of 2.5M earthquakes |
Interested in other data projects from the USGS? Here are a few more links that show how the earthquake data is crowd-sourced: